



Many investors want to invest regularly but may find it difficult to understand how different investment periods can influence projected outcomes. A Systematic Investment Plan, or SIP, allows investors to contribute a fixed amount to a mutual fund at regular intervals.
SIPs can reduce dependence on choosing a single market entry point, although investments remain exposed to market movements and returns are not guaranteed. An SIP return calculator can help investors compare estimated corpus values across five-year, ten-year, and fifteen-year periods using assumed contribution and return inputs.
This blog explains how investment duration may influence projected SIP outcomes and why longer time horizons can make compounding effects more visible.
The Basics of Growing Your Money
Before comparing different investment periods, it helps to understand how regular SIP contributions are represented in financial projections. A Systematic Investment Plan involves investing a fixed amount at regular intervals, regardless of changing market levels.
This can create a rupee cost-averaging effect. When a mutual fund’s NAV is lower, the fixed contribution purchases more units. When the NAV is higher, it purchases fewer units. This may reduce dependence on selecting one entry point, but it does not eliminate market risk or assure returns.
An SIP return calculator estimates the future value of regular investments using the SIP amount, investment period, and an assumed rate of return.
A commonly used formula is:
T = P × ({[1 + r]^n – 1} / i) × (1 + r)
In this formula,
T: Maturity amount (the total value of your investment at the end)
P: SIP amount (the fixed amount you invest)
n: Total number of SIP payments
r: Rate of interest per period
An online mutual fund SIP return calculator performs this calculation automatically. The result is an illustrative projection, and actual market-linked returns may differ from the estimate.
Comparing 5-Year, 10-Year, and 15-Year Timelines
To understand how investment duration can influence projected outcomes, consider a monthly SIP of ₹10,000. The following illustration assumes an annual return of 13%, compounded monthly. This rate is hypothetical and should not be treated as a standard or assured return for equity mutual funds.
An SIP return calculator allows investors to keep the contribution and assumed return unchanged while comparing different investment periods.
- 5-Year Plan: Understanding the Early Compounding Phase
Over five years, the total amount invested would be ₹6 lakh. Under the assumed return scenario, the estimated portfolio value would be approximately ₹8.31 lakh, resulting in a projected gain of around ₹2.31 lakh.
A five-year period may provide some benefit from compounding, but equity-market volatility can still materially affect actual outcomes. Suitability depends on the investor’s goal, risk tolerance, and required withdrawal date.
- 10-Year Plan: A Longer Compounding Period
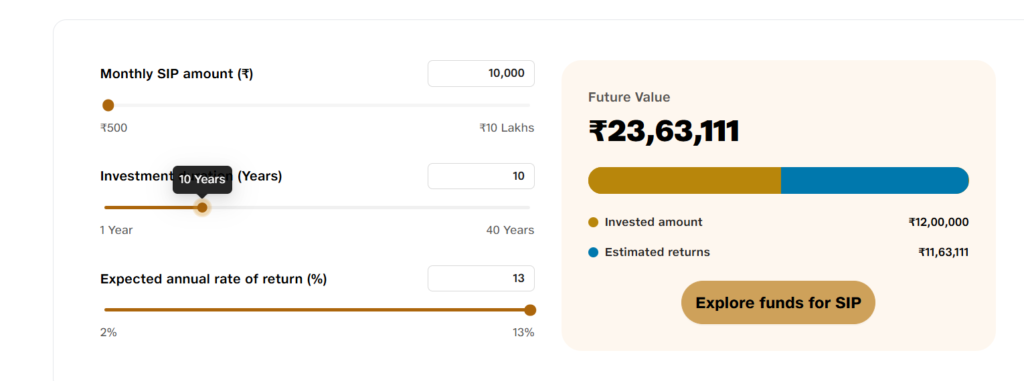
Over ten years, the total contribution would increase to ₹12 lakh. Based on the same assumed return, the estimated portfolio value would be approximately ₹23.63 lakh.
The projected gain of around ₹11.63 lakh illustrates how a longer investment period can increase the contribution of compounding. However, actual mutual fund returns may be higher or lower than this estimate.
- 15-Year Plan: The Big Compounding Payoff
Over fifteen years, the investor would contribute ₹18 lakh. Under the assumed return scenario, the estimated portfolio value would be approximately ₹51.85 lakh, including a projected gain of around ₹33.85 lakh.
This illustration shows how compounding can become more visible over longer periods. It does not, however, guarantee that the assumed return will be achieved consistently.
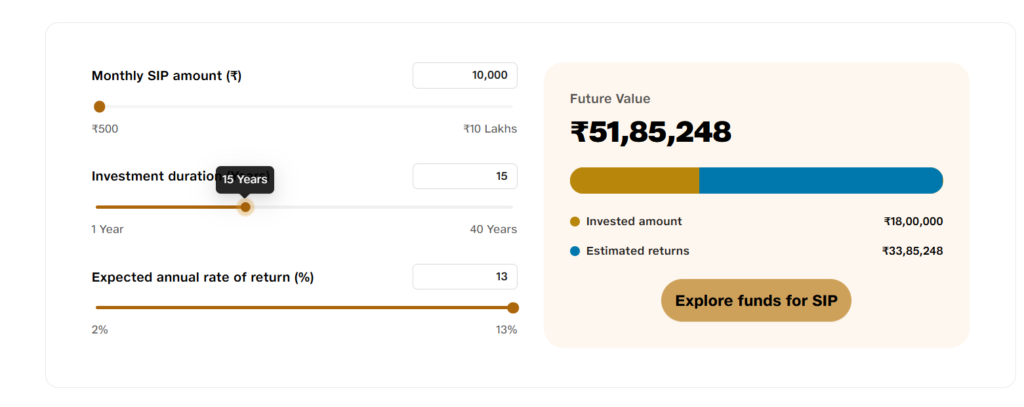
Between the five-year and fifteen-year examples, the amount invested increases threefold, while the estimated gain rises by more than fifteen times under the stated assumptions. This difference reflects the mathematical effect of a longer compounding period, not an assured investment outcome.
Simple Steps to Run Your Own Comparison
Comparing different SIP scenarios is straightforward. An SIP return calculator can help illustrate how changes in contribution amount, assumed return, and investment duration may affect projected outcomes.
- Open the Calculator: Use an SIP return calculator provided by a recognised fund house, financial platform, or investor education website.
- Enter the Monthly Contribution: Add the amount you plan to invest regularly.
- Choose an Assumed Return: Enter a reasonable hypothetical return for comparison. Do not treat historical fund returns as an indication of future performance.
- Compare Investment Periods: Review projected values across five-year, ten-year, and fifteen-year timelines while keeping the other assumptions unchanged.
- Record the Estimates: Note the total amount invested, estimated gains, and projected corpus for each period.
- Relate the Results to Your Goal: Assess which timeframe appears more aligned with your financial objective, risk tolerance, and expected withdrawal date.
An SIP return calculator can make scenario comparison easier, but its results remain illustrative. Actual mutual fund returns may differ because they are market-linked and are not guaranteed.
Why Staying Invested Matters
SIP projections can illustrate how the contribution of compounding may become more visible over longer investment periods. In the early years, a large part of the portfolio value generally comes from the investor’s own contributions. Over time, any returns generated may also participate in subsequent market movements, subject to actual fund performance.
Under positive assumed return scenarios, the difference between invested capital and projected portfolio value may widen during later years. This is why investment duration is an important variable when using an SIP return calculator. However, longer holding periods do not guarantee positive returns or remove market risk.
Investors can use tools available through online investment platforms like Jio BlackRock to compare contribution amounts, timelines, and assumed return scenarios. These estimates may support goal planning, but actual outcomes can vary.
Equity markets may experience short-term volatility and periods of decline. Remaining invested for longer may reduce dependence on a single entry or exit point, but it does not protect capital from market losses. Periodic review against financial goals, risk tolerance, and fund performance remains important.
